Improving A/B Tests reliability in Google Play
 by Simon Thillay
Head of ASO at AppTweak
— 8 min read
This article was also presented during the ASO Conference Online on May 13th, 2020.
A/B testing has become a standard practice in mobile marketing with ASO being no exception to the rule. The principles are simple: divide your audience in various samples, show them different variants (for instance, different sets of screenshots), and measure how each variant performs to decide which one to use based on data rather than personal preference.
The problem is, test results are only as reliable as your tests themselves, and while Google Play has some major benefits such as running your tests in a native environment, many ASO practitioners have seen the tool predict conversion uplifts that never occurred once they had applied the winning variant to 100% of users. These results, called false positive results, can be explained by statistical flaws of Google Play and we believe they can be detected in some cases with our new testing method.
1. Understanding “statistical noise” in your Google Play A/B tests
Some of the main reasons behind false positive results lay in how test samples are built in Google Play: with no data breakdown available in Google Play Store Experiments results, it is likely that Google’s A/B testing tool does not differentiate between users. Unfortunately, this can cause major unbalance in the conversion of your different samples simply because users arriving on your app’s store page are not all the same and can have very different intentions:
- Users who have searched for your exact brand name are very likely to download your app without even taking a few seconds to look at your store listing, as their awareness of your app is very likely to be high.
- On the other hand, users coming from a UA campaign or from a generic search might be looking for confirmation that what they were promised in the ad is what they will get after downloading, and therefore be much more sensitive to elements of your store listing.

Users are not filtered by their traffic source when conducting A/B tests with Google Play Store Experiments
By not differentiating users before assigning them to different variants of your A/B test, Google Play Store Experiments are likely to end in different test samples being composed quite differently and therefore result in significant differences in conversion that have nothing to do with your different variants.
Another issue is how seasonality can affect what goes on in the store, and thus move the needle in how each sample in your test performs from one day to the next. While it’s not something you can control per say, it is a parameter you can take into account for how you run A/B tests:
- Run your tests for at least 7 days to limit the influence of weekly seasonality: despite this being a best practice recommended by Google themselves, the Google Play Store Experiments platform tends to declare A/B tests results in just a few days when many developers have seen that keeping the test running a few more days can change results, sometimes to the point test winners are inverted.
- Don’t A/B test creatives for a seasonal event ahead of time as users are not yet preparing for that event, but either tests at the beginning of your event or simply apply your new creatives immediately and do a pre/post conversion analysis.
Learn more about app seasonality trends with our case study on the holiday season.
2. Understanding the differences between statistical significance and statistical power
One of the key challenges to a better understanding of Google Play Store Experiments and A/B testing in general is understanding the underlying statistical model behind an A/B test. To be truly conclusive, an A/B test needs not only to measure if there are big enough (aka significant) differences between results obtained with variant A and results obtained with variant B, but also give you an idea of how likely your test is to detect any difference (not detecting true differences would be called a false negative result) and how likely it is to conclude there are differences when in fact there are none (false positive results).
Google Play Store Experiments all rely on a statistical model called the 90% confidence interval, which has already two major drawbacks:
- This significance level is below the standard of 95% confidence interval used in most A/B tests.
- Play Store Experiments do not provide any clear data on how reliable different tests are, which can lead you to think all tests have the same likeliness to lead to the predicted results, when in fact some tests are more reliable than others.
The reason for that is that the statistical power of an experiment comes from the size of each sample, with larger samples not only reducing the risks of finding false positive results, but also improving the chances that you will detect smaller uplifts in conversion.
3. Running A / B / B tests to flag false positive results
Having isolated likely suspects for why Google Play Experiments gave us false positive results more often than not, our team tried to think about how we could limit the risks of encountering them, but also improve our chances to know from the test results already how likely it was that our results were false positive ones.
Our conclusions were that:
- It is crucial to keep all tests running for at least 7 days in order both to limit potential misguided results due to weekly seasonality AND to ensure good enough sample sizes that would increase the statistical power of all tests.
- ASO practitioners should not shy away from running tests while their marketing team runs UA campaigns, but need to ensure that the traffic split between each marketing channel remains stable during the entire test.
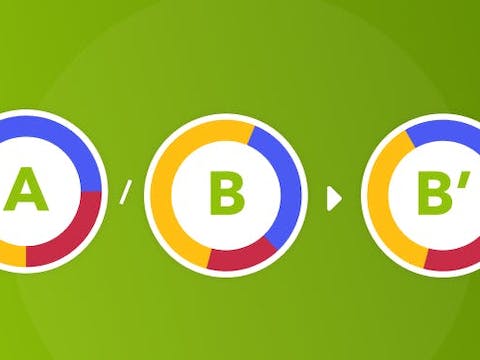
- Creating two of the same B variants in the test (→ effectively designing an A / B / B test rather than A / B) will help assess if results are likely to be true of false positive: if both B samples provide similar results, then these are likely true positive, whereas if they have different results, one of the two is likely a false positive.
- A consequence of this structure is that samples should have respectively 33.34%, 33.33% and 33.33% of traffic, and no other (C) variant should be added to the test.

With very different results between the first and second B samples, A / B / B tests can flag suspicious results where at least one of the two results is a false positive.
The benefits of this new protocol are especially that they provide an assessment of the test reliability in just one week, whereas another famous method would have been to run an A/B test the first week, and the a B/A test the second week to confirm results from the first test. While both methods are good practices to avoid applying false positive results, we found the A / B / B test structure was helpful to reduce the amount of time needed to take action while also ensuring the “confirmation” sample would be tested at the same time and therefore not have different seasonality biases.
4. Assessing the impact of the A / B / B method: calling for the help of all ASO practitioners
Having educated ourselves about statistics, our next goal regarding A / B / B test will be to try and assess the real impact they can have for ASO practitioners, which is why we are calling all willing readers to try this method with their apps and share some results with AppTweak, so we can hopefully share with you in a later article the true impact of A / B / B tests and especially how often they have detected false positive results or how often they were not enough to detect them.
The information we would like to get from you for each test includes:
- App name (optional)
- App category
- Store listing of the test (Global / en-us default / en-uk / es-spain / …)
- Start & end date
- What variant type did you test?
- Applied traffic split
- Installers per variant
- Lower limit of the confidence interval
- Upper limit of the confidence interval
- For applied variants, conversion uplift between the week after your test and the week before.
You can find a template for sharing your test results here. These data will be kept confidential by AppTweak and only used for aggregating statistics regarding the A / B / B test method.
If you are willing to share some test results or have questions regarding the A / B / B method, we also invite you to contact our team on our website, via email, social media or on the ASO Stack slack channel.